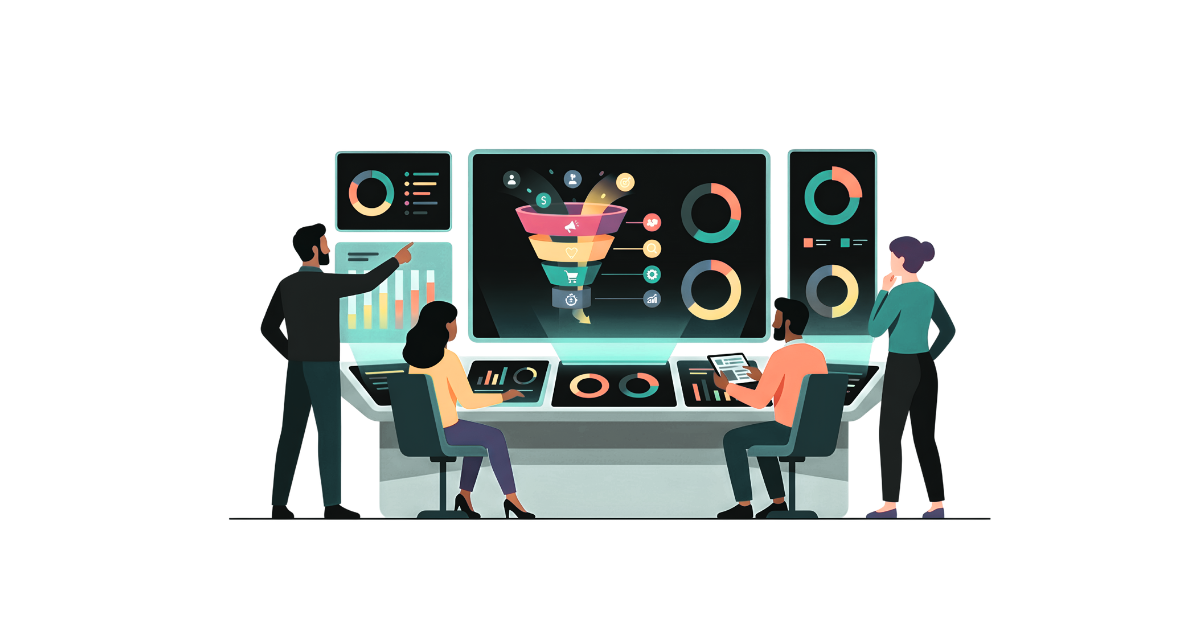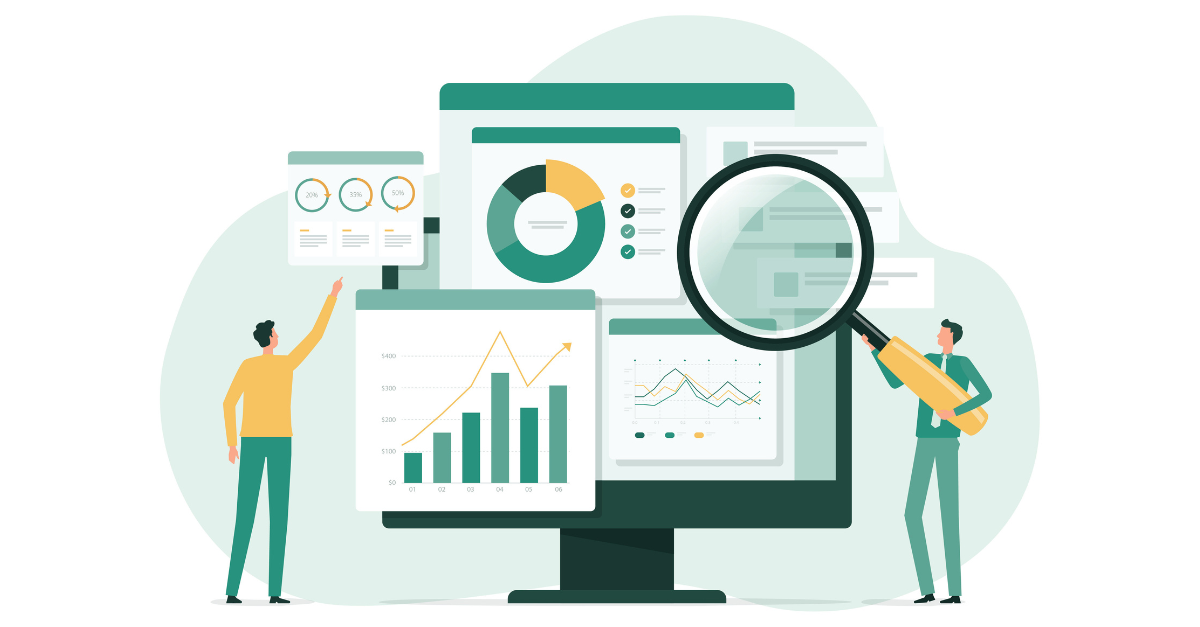

Most marketing teams aren’t struggling to get data. They’re struggling to use it.
Dashboards pull in metrics from every channel, offering a comprehensive view of performance. On the surface, everything looks clear. But clarity in presentation doesn’t always translate to clarity in action.
The real challenge is turning that data into clear, confident decisions. Many dashboards are built to answer the question, “What’s happening?” But they stop short of addressing the more important one: “What should we do about it?”
A strong marketing dashboard does more than organize data. It sharpens focus, highlights what’s meaningful, and makes the next step obvious.
What Is a Marketing Dashboard (and Why Most Fail to Deliver Value)
At its simplest, a marketing dashboard pulls data from your CRM, analytics tools, ad platforms, email systems and puts it all in one place.
In theory, it should make your job easier. In practice, it often doesn’t. Most dashboards are built to show performance. Not to guide decisions.
You’ll see charts for sessions, impressions, click-through rates, and conversions, but no real clarity on what to change, double down on, or stop doing. And that’s usually where teams start to feel stuck, not because they lack data, but because the data isn’t pointed at a decision. Learn more about making smarter, quicker marketing decisions with proper attribution and automation in our blog.
Instead of building a dashboard that shows everything, you build one that highlights what matters in a specific moment. Instead of reporting on performance, you guide action. You’re not reporting for the sake of completeness. You’re shaping information around a choice.
That’s the difference between a dashboard people glance at and one they rely on.
The Evolution of Marketing Dashboards: From Static Reports to Decision Engines
It’s helpful to zoom out for a moment and look at how marketing dashboards have evolved, because a lot of the friction teams feel today is rooted in how these tools were originally used. A lot of teams are using modern tools with an older mindset.
Older dashboards were often static reports. They aggregated data and presented it in a structured way. The goal was visibility, getting everything into one place, so teams didn’t have to pull numbers manually. They were essentially big reports:
- Lots of metrics
- Static views
- Heavy on visibility, light on direction
The idea was: if we can see everything, we’ll understand what’s happening. But in reality, these dashboards created noise. Too many metrics. Not enough context. No clear priority. Teams ended up tracking everything and acting on very little.
We touch on data fatigue and how to simplify marketing reports in our blog.
Modern Marketing Analytics Dashboards
Earlier dashboards tended to prioritize volume. The more data you could include, the more complete the picture felt. Today’s digital marketing dashboard looks different. Most teams have access to:
- Real-time or near-real-time data
- Cross-channel visibility
- Automated reporting
- AI-assisted insights (like anomaly detection or trend surfacing) Is your CRM ready for AI? We touch on data maturity in our blog.
Modern dashboards are increasingly built with intent. Instead of trying to serve every purpose at once, they’re designed around specific use cases: optimizing a live campaign, understanding contribution to pipeline, aligning marketing and sales, or tracking lifecycle performance over time.
Even with better tools, data alone doesn’t create clarity. People need context. They need interpretation. They need a narrative. People still need help answering:
- What is happening?
- Why?
- Does it matter?
- What do we do about it?
Rather than treating dashboards as endpoints, teams are beginning to use them as part of a larger narrative, one that connects performance to cause, and cause to action. When that’s done well, dashboards stop being passive displays and start functioning more like guided conversations.
We share more on the state of analytics in our blog.
The KPIs That Actually Matter (And How to Choose Them)
If dashboards struggle, KPI selection is often part of the reason.
Most platforms make it easy to track almost anything, which can make it tempting to include more than necessary. Over time, that can dilute focus rather than sharpen it.
A more useful approach is to think of KPIs as signals tied to specific decisions, rather than as a comprehensive list of everything available.
Avoiding Vanity Metrics: What Not to Track
Some metrics look useful on the surface but don’t carry much weight on their own.
Traffic, impressions, and even conversions can be misleading without context. They can move in positive directions while underlying performance stays flat or even declines.
That doesn’t mean they should be ignored. It just means they need to be paired with deeper indicators that explain what’s actually happening.
Core KPI Categories for Marketing Dashboards
To keep things balanced, it often helps to group metrics into a few core categories:
- Acquisition: how people are finding you
- Engagement: what they do once they arrive
- Conversion: how they take action
- Revenue: what that action ultimately produces for the business
Looking across these categories makes it easier to spot disconnects, for example, strong acquisition paired with weak conversion, or high engagement with limited revenue impact.
Mapping KPIs to Business Goals
The most important filter, though, is relevance.
The right KPIs depend on what the business is trying to achieve right now. Growth, efficiency, retention, and pipeline acceleration all point to different sets of priorities.
When dashboards reflect those priorities clearly, they become much easier to trust and much more useful in practice.
Data Storytelling: The Missing Link in Most Marketing Dashboards
Even well-designed dashboards can fall short if they stop at presentation. What tends to make the biggest difference is how the data is interpreted and communicated.
What Is Data Storytelling in Marketing?
Data storytelling is about connecting three things: what happened, why it happened, and what should happen next.
Dashboards already do a good job of capturing the first part. Storytelling fills in the rest.
The 3 Elements of Effective Data Stories
- Context helps frame what you’re seeing
- Insight explains the underlying drivers
- Action points to the next step
When all three are present, the data becomes much easier to use.
Turning Metrics into Narratives
A small shift in framing can change how a dashboard is used.
Instead of simply noting that a metric moved, the focus turns to explaining the cause and outlining a response. Over time, this builds confidence, not just in the data, but in the decisions that follow.
Marketing Dashboard Design Best Practices
As dashboards become more decision-focused, design becomes less about aesthetics and more about usability.
1. Keep It Simple
Restraint tends to be more valuable than completeness.
By limiting the number of metrics and focusing on what matters most, you make it easier for users to interpret the dashboard quickly and accurately.
2. Use Visual Hierarchy
Placement, size, and grouping all influence how information is processed.
When the most important metrics are easy to find, the dashboard naturally guides the user toward the right questions.
3. Match Charts to Data
Different formats serve different purposes.
Choosing the right visualization is about clarity. The goal is always to make interpretation easier, not more visually complex.
4. Make Dashboards Accessible
For dashboards to be effective, they need to be understood across teams.
That usually means simplifying language, reducing jargon, and ensuring that the context is clear enough for non-specialists to follow.
The Takeaway
When dashboards are working well, they change how decisions are made.
Instead of spending time gathering and interpreting data, teams can focus more on acting on it. Priorities become clearer. Conversations become more productive. And decisions happen with more confidence.
If your dashboards feel more like reports than tools, you’re not alone. And you don’t have to solve it on your own. emfluence helps marketing teams make sense of their data and use it with confidence. Reach out to our experts at expert@emfluence.com.