At the intersection of relevance and creativity, it is easy to get frustrated with how much work can be involved in creating compelling visual content. Fortunately, there are tools to help alleviate some of your stress and provide you with high quality content all at once! Below, you will find a list of my top 5 tools for creating infographics (although there are many more out there) and the ways that each of them varies. Each of them has something special to offer with increasing features and involvement as you go down the list.
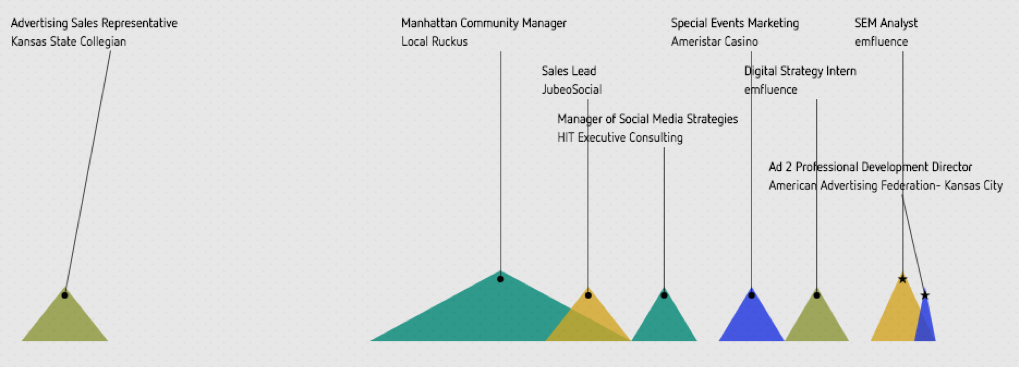
Vizualize.me
This tool is a quick and easy permissions-based web app that taps into your LinkedIn profile (or email address) to give you a professional infographic format of your profile. Depending on how thorough your linkedIn profile is, you can even add graphics for languages, different countries worked in and volunteer experience. Visualize.me makes customizing colors and themes very intuitive with just a few simple clicks using a side navigation menu. If you weren’t already sold on trying this one out, did I mention it’s free?
Easel.ly
This particular web-app makes a name for itself by introducing the drag-&-drop menu style, adding an extra level of customization. The Easel.ly tool features a healthy variety of basic templates with the option to get more complex if you are willing to throw some money their way. In either case, this is definitely a tool worth looking into. The video below will show you just how easy it is to create beautiful infographics but take my word for it, this tool will save you time!
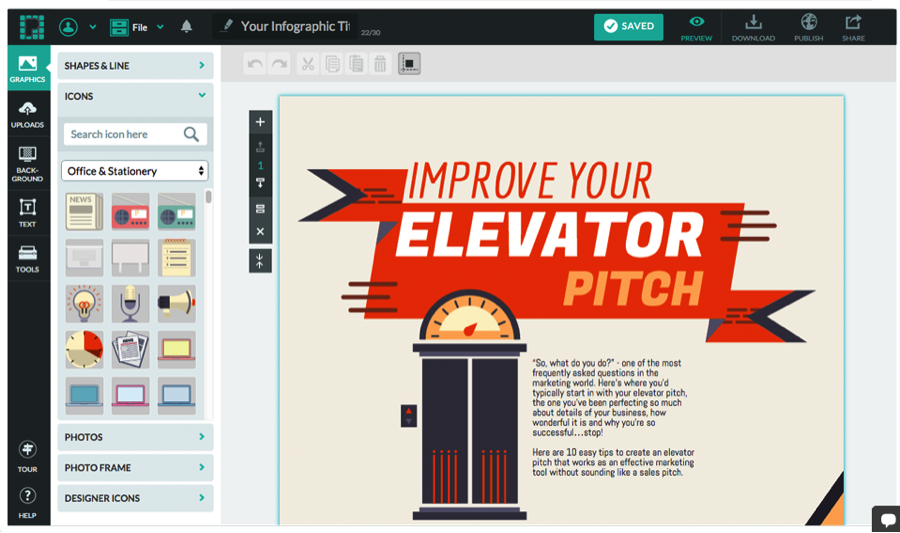
Piktochart
With more than 2,000 standard vector files for you to use for customization, Piktochart is definitely worth spending a little time getting to know. The use of a WYSIWYG editor and a drag-&- drop interface (similar to Weebly, Wix or Squarespace), your options are almost limitless with this program. It should be noted that with so much freedom to create in this program, if you have a designer or even a visually inclined person on your staff, it would be best to let them handle this one! Take a look at the image below to get an idea of the menu and editor tools at your disposal.
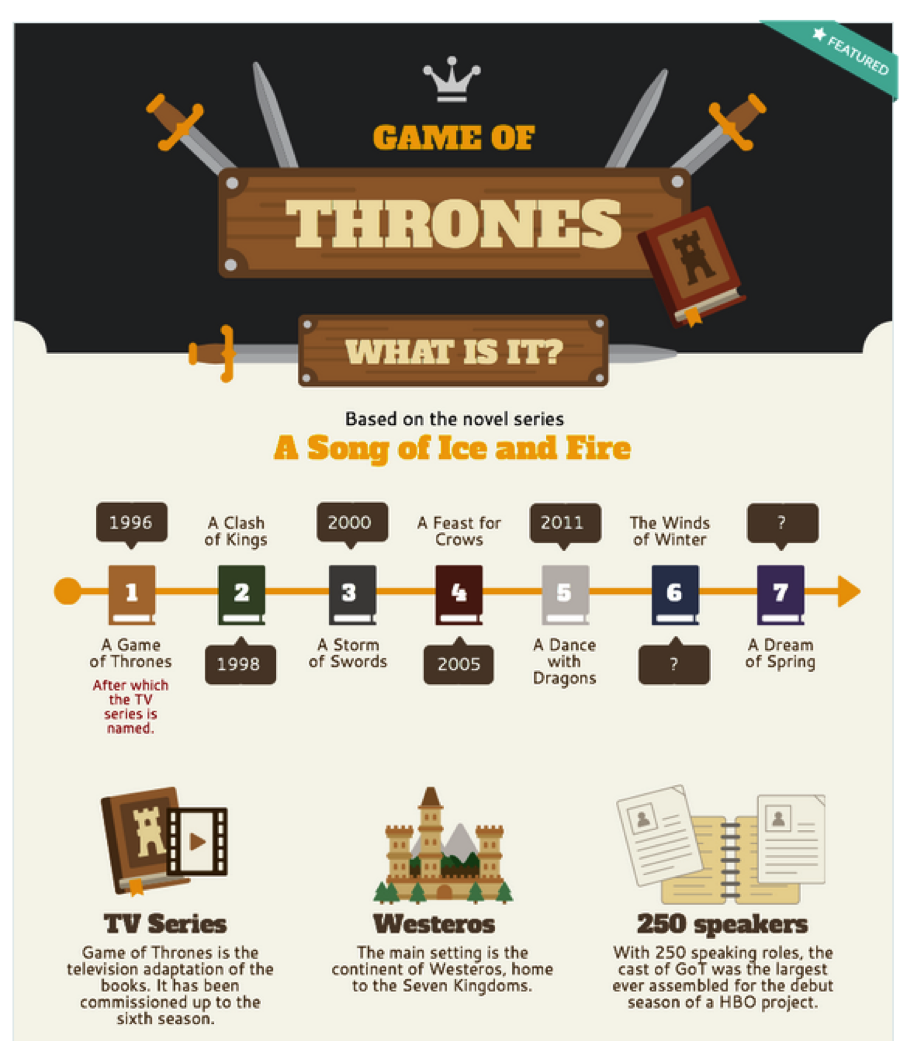
See an example of a finished visual from Piktochart below:
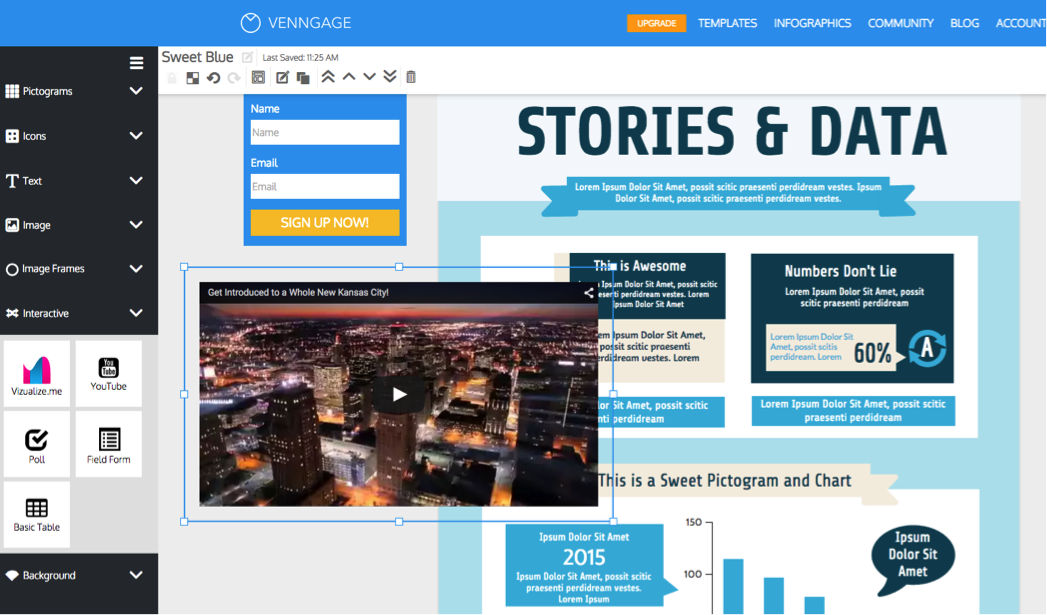
Venngage
This by far, is the closest thing you can get to the creative suite of Adobe Photoshop in a web-app format. I will caution that the amount of customization features in this tool can seem overwhelming but fear not; it just takes time to learn. If you are willing to invest a little of your own time in the beginning to familiarize yourself with this incredible tool, it will pay dividends in the end. Another key feature of this tool to remember is the ability to share your content with major social media networks from within the app, removing additional steps from your workload! With a graph for ease of layout and the option to tweak individual vector images, this tool is one for aspiring professionals. View the images below to see the features in the program as well as what the interface looks like.
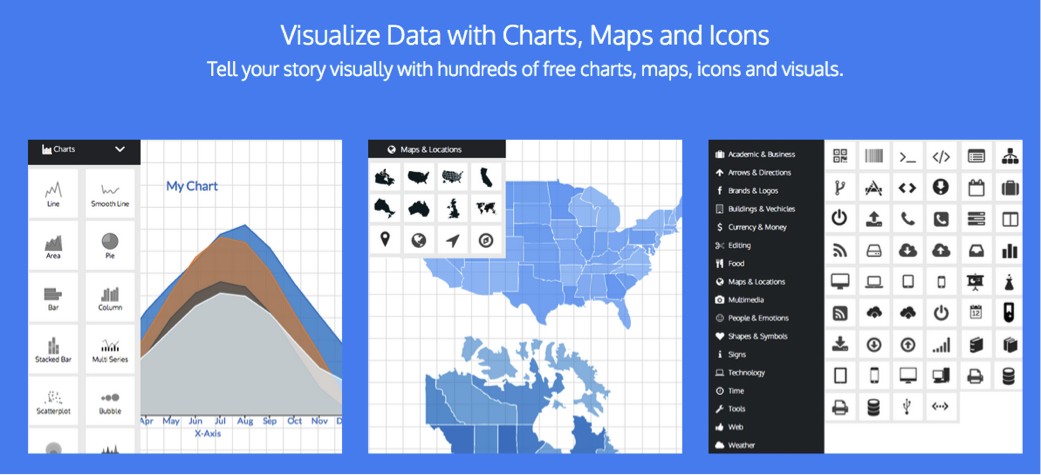
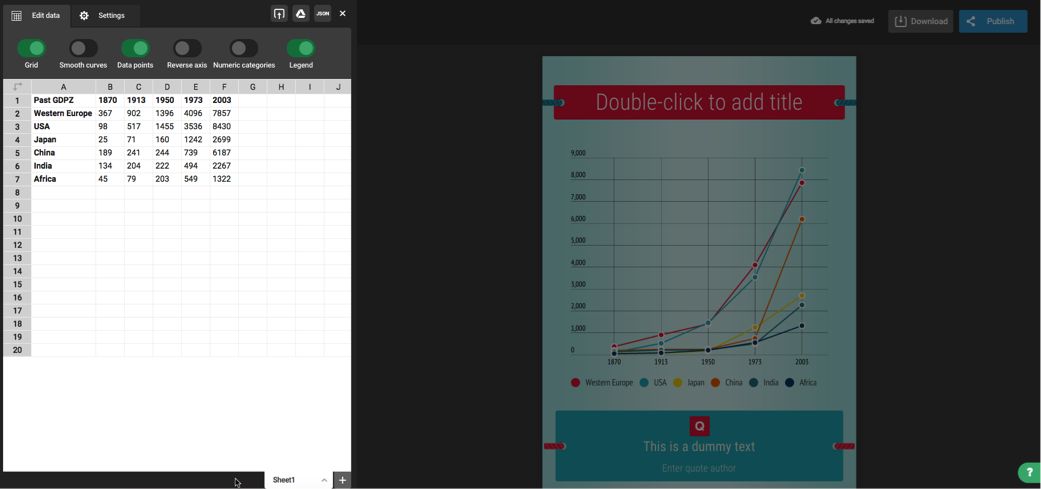
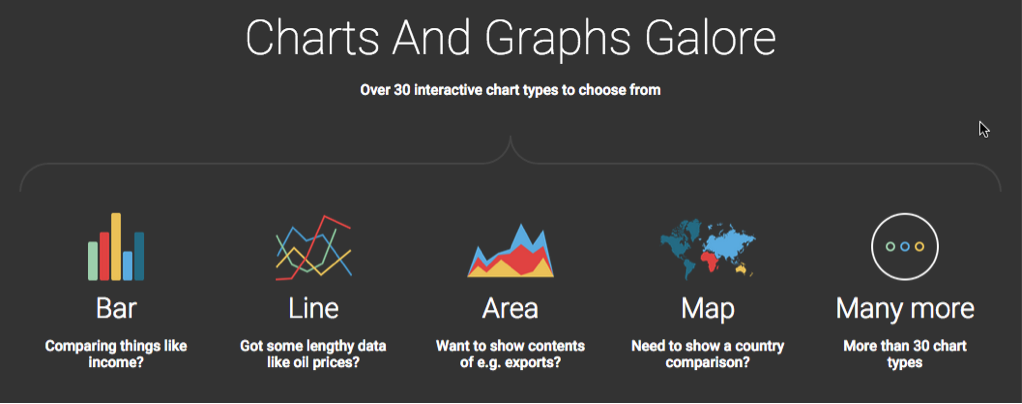
Infogr.am
Now for the final tool on my list, the Big Sha-Bang, the Coup De Grace, the Big Cheese if you will. Real time data manipulation as well as the ability to download and embed your visual data take this tool into it’s own level of customization features. The responsive design elements for tablet and mobile viewing really take this tool into a league of its own, but that doesn’t mean you should write it off. Patience, or help from a web developer, is key to mastering this tool and the results are worth it!
In the meantime, between getting your content embedded on you site, take a moment to familiarize yourself with the CSV import feature and template options that this unique tool boasts. This tool will set you back $42 a month to use all of the features but fortunately, it has a 30 day trial period to see if it is right for you. The images below will offer a preview to the amazing things this tool can do!
[more]
Remember, learning curves will always be there but so is the satisfaction of knowing you mastered a new skill and created something amazing! Get out there and try these tools to see the creative visual marketing content you can use in your own business. Happy creating! Click here to sign up for our emfluence emsights email newsletter and get more great insight like this sent to your inbox!